A View from the Tower- First Quarter 2024

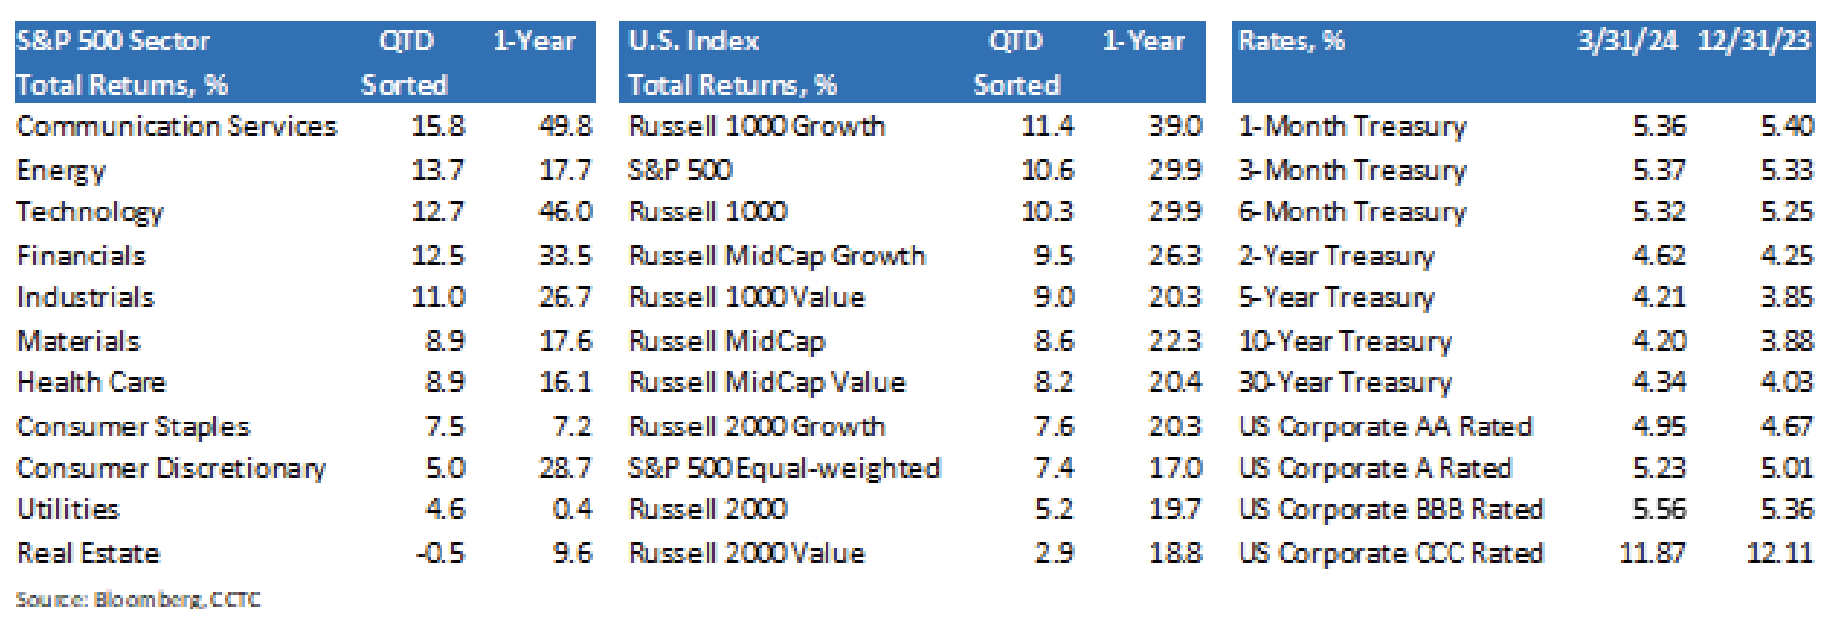
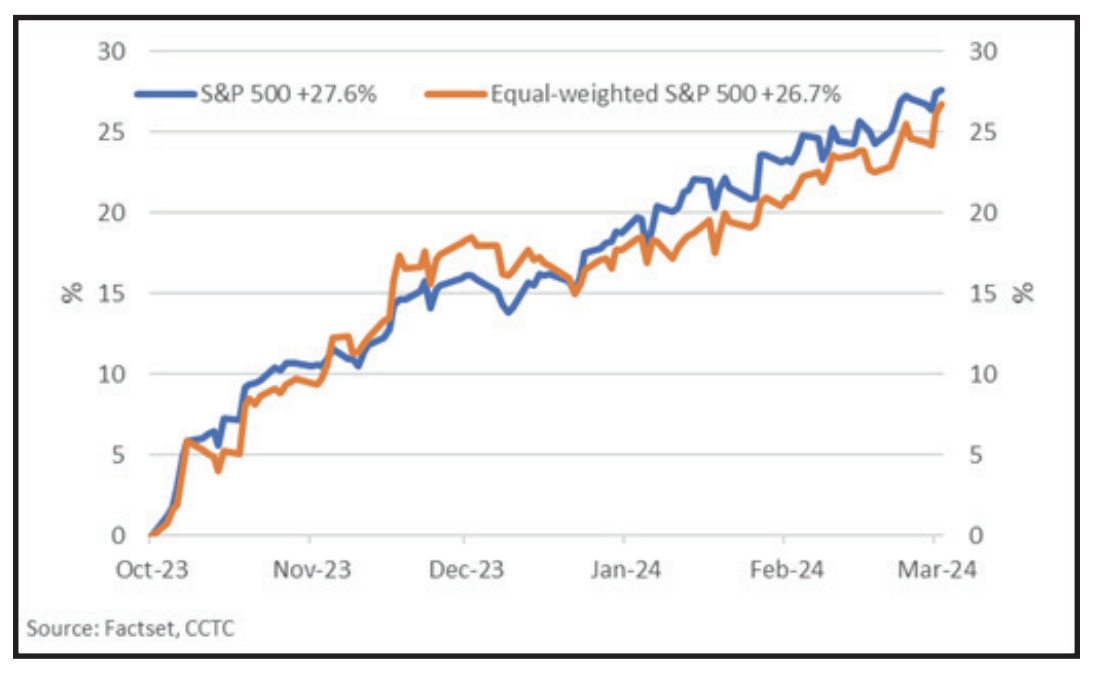 2024 got off to a strong start as the S&P 500 posted its fifth gain in six quarters, its second straight double-digit gain. While inflation news was somewhat mixed and the labor market continued to be tight, fourth quarter earnings results overall surprised to the upside and consumer confidence was a bright spot. During Q1, equity investors continued to prefer growth over value and megacaps over smaller stocks. This has been a theme over the past 18 months as large technology and communications services stocks have benefited from current and perceived earnings growth from artificial intelligence (AI). We view the improvement in breadth, or how the average stock is performing, since the near-term bottom in October of 2023 as positive. The average stock in the Equal-weighted S&P 500 has participated nicely versus the mega-cap names that dominate the capitalization-weighted S&P 500.
Treasury yields were significantly higher at the end of Q1 in all but the shortest maturities. Interestingly, investment grade yields were up, but not as much as Treasuries. This phenomenon is typically a sign that investors see less credit risk in owning corporate bonds. In total, price moves in bond markets over Q1 suggests the economy is on sure footing and the path going forward may be less deflationary.
New Dot-Plot From the Fed
It was no surprise to market participants that the Federal Reserve’s Open Market Committee (FOMC) left rates unchanged at its two-day meeting ending on March 20th. There were a couple of interesting tidbits, none-the-less. One, Chairman Powell confirmed that it’s quantitative tightening program could slow “fairly soon.” Second, in our opinion, markets did not judge changes to the Fed’s dot plot, or end of year 2024 Fed Funds rate, as significant.
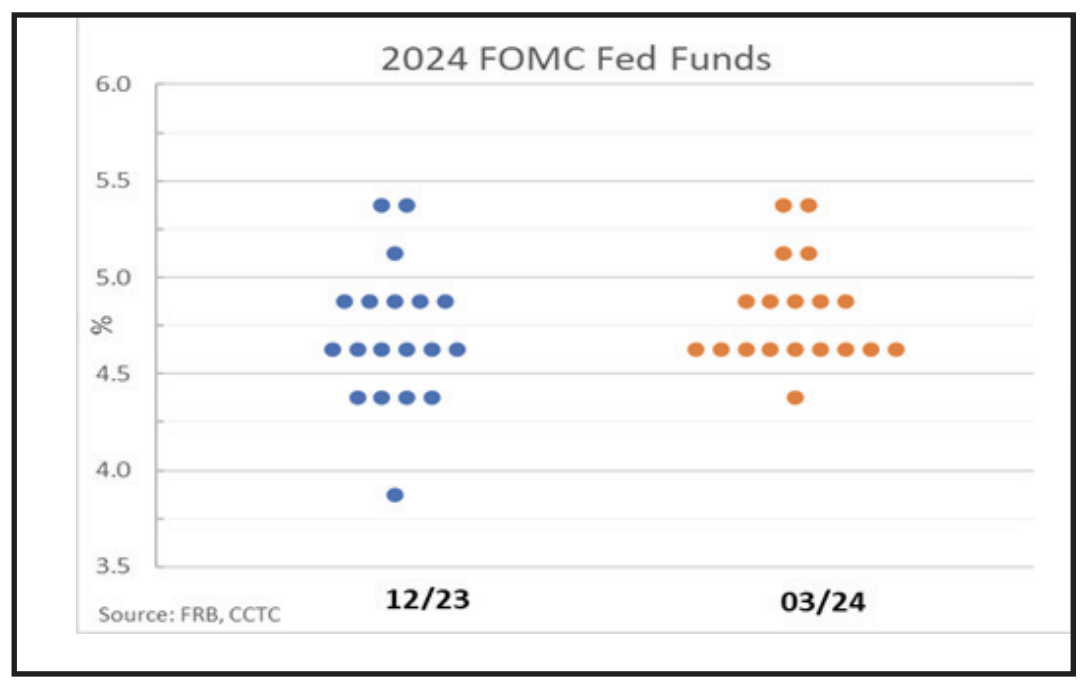 Once a quarter, the FOMC releases a Summary of Economic Projections (SEP) at the conclusion of its regularly scheduled meeting. Both bond and equity market investors anxiously wait for what could be market-moving news. There was little new information contained in the March 20 SEP. However, that was a boon for markets as the 10-Treasury yield dropped 0.09 percentage points over the following two days. Over the same period, the S&P 500 gained 1.2%. Why? No news was good news. Both bond and equity investors had been hedging themselves for a Fed decision that took one of three expected 0.25 percentage point rate cuts off the table for 2024. Recent economic data had moved in a direction that implied both the economy and inflation were stronger than anticipated, which could cause FOMC members to pull-back on rate cut expectations. Instead, the Fed barely leaned in that direction. But lean, they did. The median level of the dot plot submitted in the March SEP was unchanged from the December 2023 forecast of a 0.75 percentage point reduction in Fed Funds in 2024. However, the December projection had five dots below the median while the March SEP had only one.
 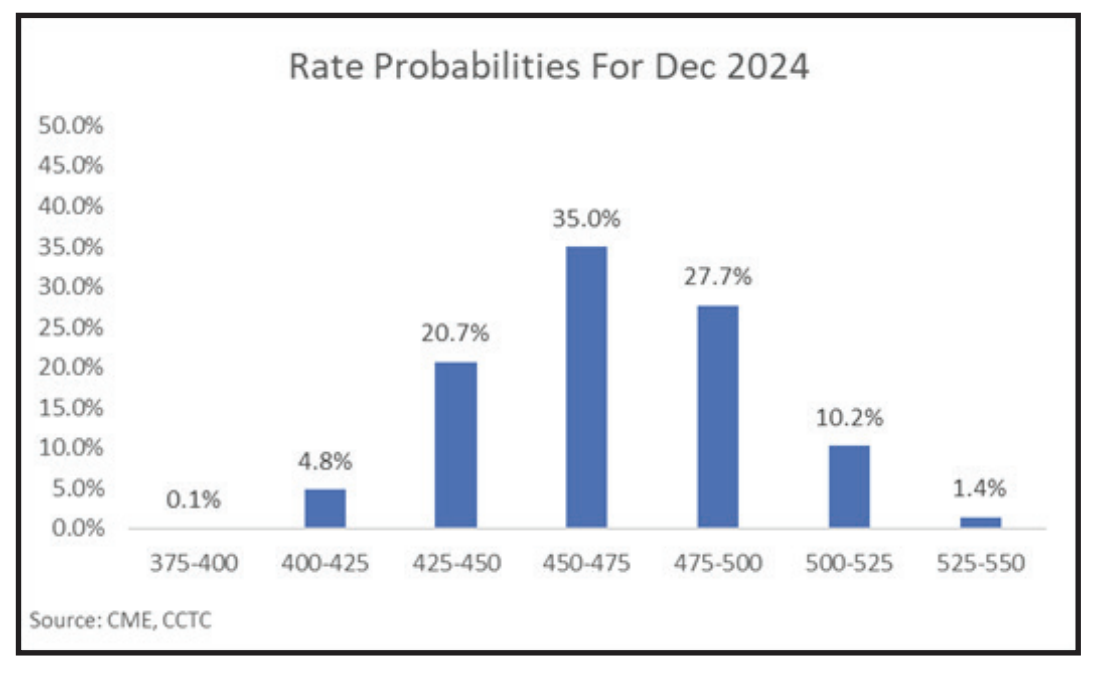 Also, there was an additional dot higher than the median in March versus December. Although the significance is questionable, there was a slightly hawkish tone in the latest SEP. It is worth paying close attention to commentary from FOMC members over the coming months for signals that may affect near-term decisions on rate cuts. We believe most equity investors have penciled in three 0.25% rate cuts through 2024. Fed Funds futures are showing only a 35% chance of three cuts by December. Also, probabilities are skewed in a way that might leave equity investors somewhat disappointed at some point.
Most notably used during the Great Financial Crisis and Pandemic, quantitative easing (QE) is an unconventional type of monetary policy in which a central bank buys securities, mainly government bonds and mortgage-backed securities, from the open market. The process increases the size of the Fed’s balance sheet with the aim of injecting liquidity into the economy, lowering interest rates and stimulating borrowing and spending. QE has also been widely cited to be a significant driver of higher equity prices. Quantitative tightening (QT), on the other hand, shrinks the Fed’s balance sheet by letting securities previously purchased mature, or outright sales. QT should theoretically have the opposite effect of QE: withdraw liquidity from the economy, promote an increase in interest rates and discourage borrowing and spending. QT, or shrinking the Fed’s balance sheet, began in the spring of 2022. This, along with raising interest rates, was used to combat high inflation by attempting to slow the economy. Logic would tell us that the withdrawal of liquidity from QT would tend to provide a headwind for equity markets, which has not seemed to have occurred so far.
The Economy Continues to Suprise
Despite considerable increases in interest rates and QT, the economy seems to be in good shape. The final estimate of Real GDP growth in Q4, 2023 came in at 3.4%, well above what most would consider potential growth of just below 2%. The Atlanta Fed’s GDPNow model is currently predicting 2.5% growth for Q1, 2024. The economy continues to thrive on liquidity that the Fed has seemingly been trying to drain from the system.
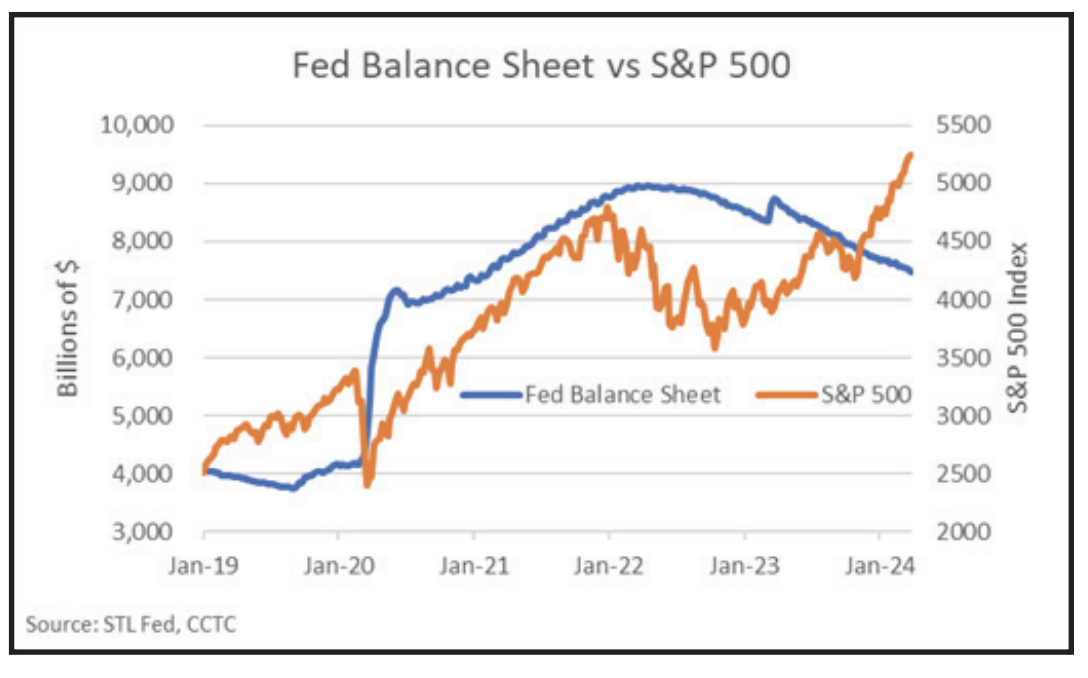 Although the relationship between liquidity and equity markets is not perfect, growth in the Fed’s balance sheet does seem to be correlated with higher equity prices. Of course, other factors such as earnings, interest rates, etc. come into play. However, in the near-term, we would anticipate most market-pundits would agree with the rough relationship shown between the Fed’s balance sheet and the S&P 500. However, there is an important caveat to the story. Market liquidity can come from sources other than the Fed. Notice that the relationship between the size of the balance sheet and the S&P 500 breaks down during the fall of 2023. Given the continued drawdown in assets on the Fed’s balance sheet during Q4, 2023, we would have expected economic growth to soften and equity price appreciation a little harder to come by.
Liquidity, Liquidity Everywhere
As we wrote about in the Q4, 2023 View From the Tower, liquidity flowing into the economy out of the reverse repo program (RRP) at the Fed has been overwhelming the withdrawal of liquidity from QT. Without getting into too many specifics, the RRP serves as a facility money-market funds can park cash overnight and earn interest similar to Fed Funds. Over the last 9-months or so, it has been advantageous for these funds to exit RRP’s and buy T-bills. It is astonishing that $1.8 trillion of liquidity has entered the system over the past year.
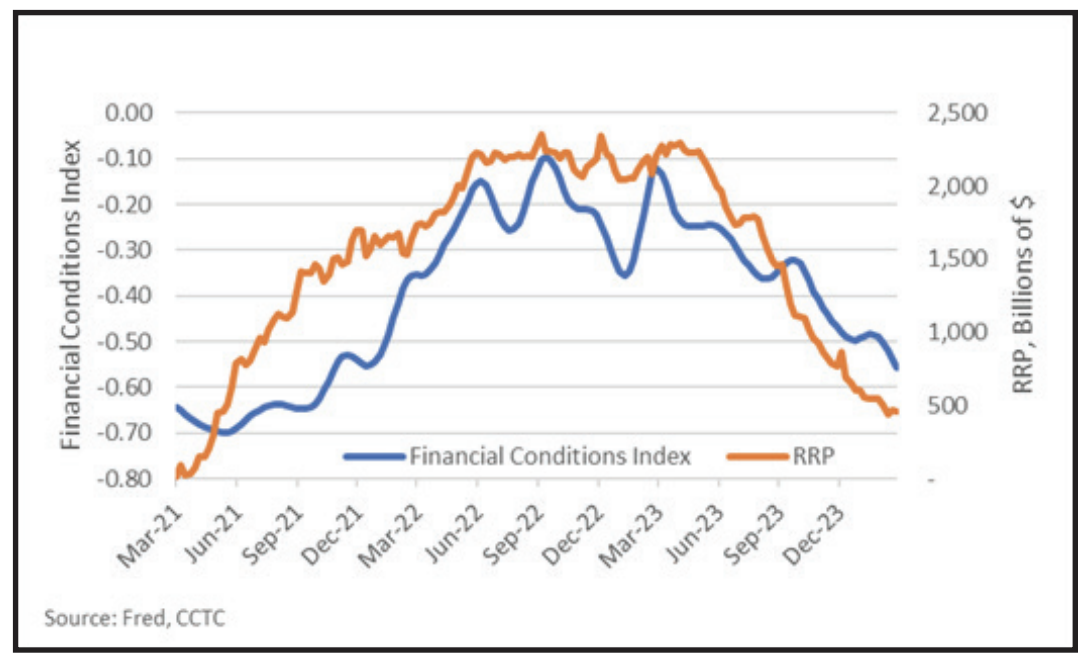 We can plainly see the effects of this liquidity deluge by looking at various financial condition’s indices. A financial condition’s index (FCI) is a measure designed to provide insights into the overall health of the financial system and its potential impact on economic growth. Although FCI’s from various providers differ, they are typically a composite index including interest rates, credit spreads, market volatility, exchange rates and stock prices. Positive FCI values indicate tighter-than-average financial conditions, suggesting higher borrowing costs and a potential impact on an economy. Negative values of the FCI indicate looser-than-average financial conditions, implying easier access to credit and potentially stimulating economic growth.
Rate hikes from the Fed have obviously not been able to contend with this kind of liquidity entering the system. Although the flow of liquidity out of the RRP is not the only reason financial conditions are currently “loosey-goosey”, we believe it’s a primary driver. However, we believe the drawdown of RRP liquidity is ending.
A Short-term Pause, Then Go
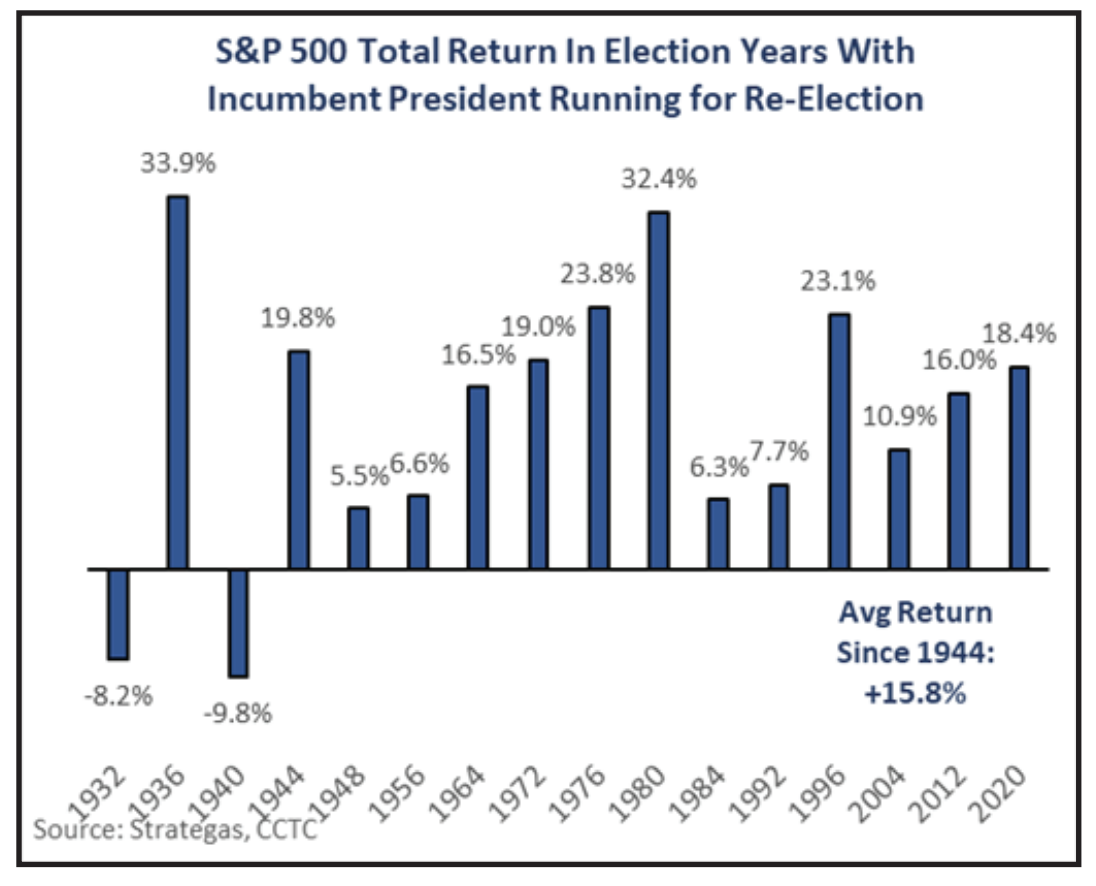 We could be entering a short window of tighter liquidity conditions. Not only will financial conditions be affected by the RRP, but also April tax collections may create a short-term liquidity and fiscal drag. As we all know, equity markets performed well in 2023. It’s time for investors to pay-up! The Treasury is expected to receive a windfall in capital gains tax revenue this year. Analysis shows Treasury sitting on $1 Trillion post-tax season, $270 billion greater than current levels. Pulling these dollars out of the economy, although briefly, should create some drag on the economy and possibly create market headwinds. However, Treasury could spend that down as we head toward November elections. Fiscal policy could provide some additional gusto as well. Spending associated with the Infrastructure Investment and jobs Act, passed in 2021, should also ramp-up into the elections. Incumbent Presidents do not like to lose when running for a second term and at this point the election seems like it could be historically tight. Greasing the wheels in an election year is commonplace. Equities typically enjoy the ride.
Our portfolios are managed with both your risk tolerance and return objective in mind. We genuinely believe that time in the market is key, as attempting to time the market is a fool’s errand. In our view, compounding returns of high-quality portfolios is key towards achieving your financial goals.
All of us at Country Club Trust Company, along with the entire Country Club Bank organization, hope that you and your families are well. Please be assured that we continue to work diligently on your behalf, providing the level of service you have come to expect and deserve. As always, we are ready and willing to be of assistance in any way we can. Should you have any questions, we are always here for you.
Take care.