ALM Basics: Market Value of Equity
**Note: This post is part of a series on the basics of asset liability management.
As discussed in an earlier "ALM Basics" post, community financial institutions have two primary methods for measuring interest rate risk; income simulation and market value of equity. As stated in that post,
For long term interest rate risk, banks calculate a market value of equity, also known as net portfolio value or economic value of equity. Market value of equity is calculated by "marking to market" each category of the balance sheet, and netting the liability market value from the asset market value. This calculation is performed under a range of rate environments, showing where the bank has more or less value to shareholders. Since marking to market is essentially a net present value calculation, it captures the entire expected life of the balance sheet, and a change in value will reflect a change in the long term interest rate risk.
Market Value of Equity (MVE) is a more abstract concept than the income simulation used to measure short term interest rate risk. In fact, we recently published a white paper (click here for access) offering a more in depth explanation of the concept and its importance to banks. In short, MVE is important because it measures the entire expected life of the balance sheet. Using MVE ensures that risk that lies beyond the end date of an income simulation is captured and evaluated. This view is shared by regulators, as MVE is getting more attention during exams than ever before. While practitioners use a variety of specific methods for measuring MVE, the basic process is the same (and closely resembles the process for an income simulation):
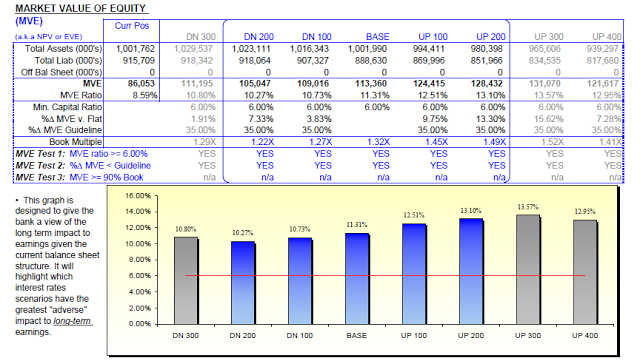
- Risk Tolerance Defined: This task is generally handled by the Asset Liability Committee (ALCO), but must always involve the directors of an institution. The directors and management must determine what level of volatility in earnings is acceptable. As with all risk decisions in finance, the willingness to accept higher volatility will result in a higher potential upside that must be weighed against the potential downside. For MVE, the bank compares the equity level in various rate scenarios compared to the equity at a base (or current) level. The risk is defined in terms of both a capital as a percentage of assets and as a percentage change from the base. While each institution must determine their own unique risk tolerance, the industry standard for MVE is at least 6% of assets (to remain a well capitalized bank) and a change of no more than 35%.
- Data Collected: In order to properly model results, the bank must collect data that will show the structure and terms of all balance sheet components, including investments, loans, deposits, and borrowings. While this is sometimes aggregate data based on broad categories (i.e. from call report filings), the trend has been for more banks to use instrument level data in order to accurately model results (click here for more on this issue). The data will include structure and term information such as repricing date, index, margins, repricing frequency, floors, ceilings, etc.
- Assumptions Created: MVE uses many of the same assumptions as an income simulation, but must also determine a functional life for non-maturing deposit accounts. This is necessary so that the accounts can be compared to alternative funding sources of the same duration in order to determine their relative value.
- Model is Run: Once the data is collected and the assumptions have been built, the model can be run to calculate MVE in different rate scenarios. The guidance suggests that MVE calculations cover a wide range of rate scenarios. The scenarios generally include rates moving up and down by 400 basis points, as well as non-parallel shifts like a steepening or flattening yield curve.
- Results Compared to Policy Limits: After the model has been run, the results can be compared to the tolerance levels established by the directors. The reports often look something like this:

Just as with an income simulation used to measure short term interest rate risk, MVE can either be handled in house or can be outsourced. The modeling is generally less complex than an income simulation simply because it does not take as many iterations of the data since it is a snapshot in time of a static balance sheet. However, MVE calculations are often the ones cited by examiners for not being handled properly, with misleading results causing banks to manage risk in the wrong direction. If you are calculating MVE in house, proceed with caution, and make sure you fully understand why the results look the way that they do. Whether you do it in house or outsource it, I recommend you look over the white paper for more details.