Feeling the Squeeze
I spent most of May on the road speaking with bankers from Iowa to Texas. The common theme in these discussions was “credit quality”. Credit quality seems to be a very common concern among many bankers in both rural settings, as well as metro locations. This concern isn’t that banks are seeing charge-offs or delinquencies at this point. Rather, it is more that the spread between the best credit, a good credit, and a not-so-good credit is very tight. In fact, we see in the first graph below the option-adjusted spread (OAS) between a BBB, or better credit (investment grade), and the spot treasury curve is back to levels that we saw prior to the last recession.
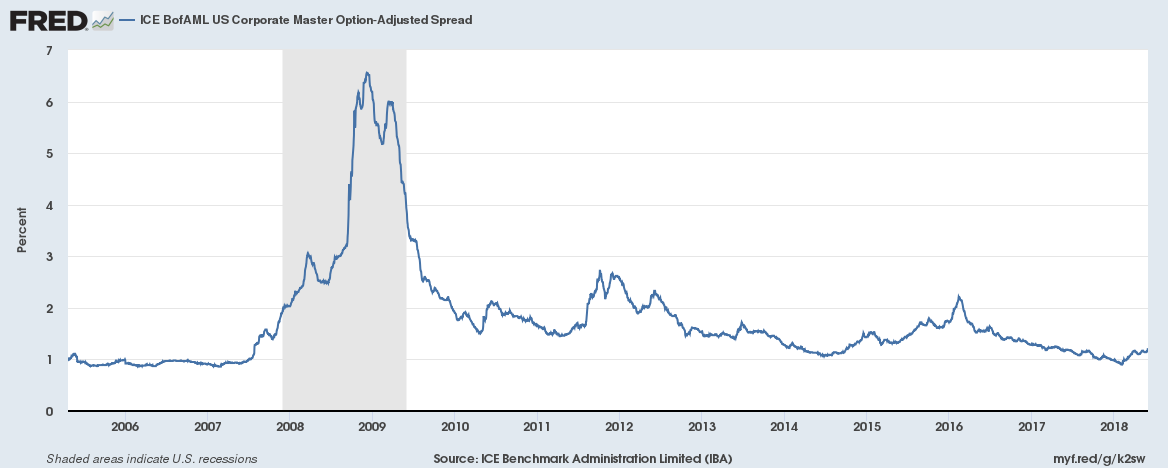 Source: ICE Benchmark Administration Limited (IBA), ICE BofAML US Corporate Master Option-Adjusted Spread [BAMLC0A0CM], retrieved from FRED, Federal Reserve Bank of St. Louis; https://fred.stlouisfed.org/series/BAMLC0A0CM, May 31, 2018.
If we look at the OAS of a BBB rated corporate and the spot treasury curve in this next graph, we see that the spread in this example is back at the levels just prior to the last recession as well.
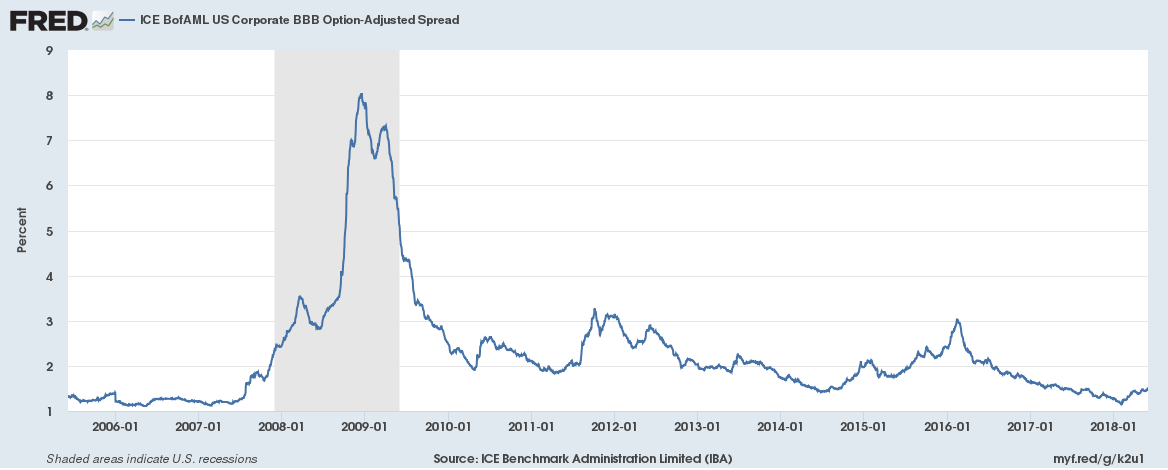
ICE Benchmark Administration Limited (IBA), ICE BofAML US Corporate BBB Option-Adjusted Spread [BAMLC0A4CBBB], retrieved from FRED, Federal Reserve Bank of St. Louis; https://fred.stlouisfed.org/series/BAMLC0A4CBBB, May 31, 2018.
Lastly, looking at the OAS of a BB rated corporate or lower to the spot treasury curve, the spread here is also, back in the pre-recession position.
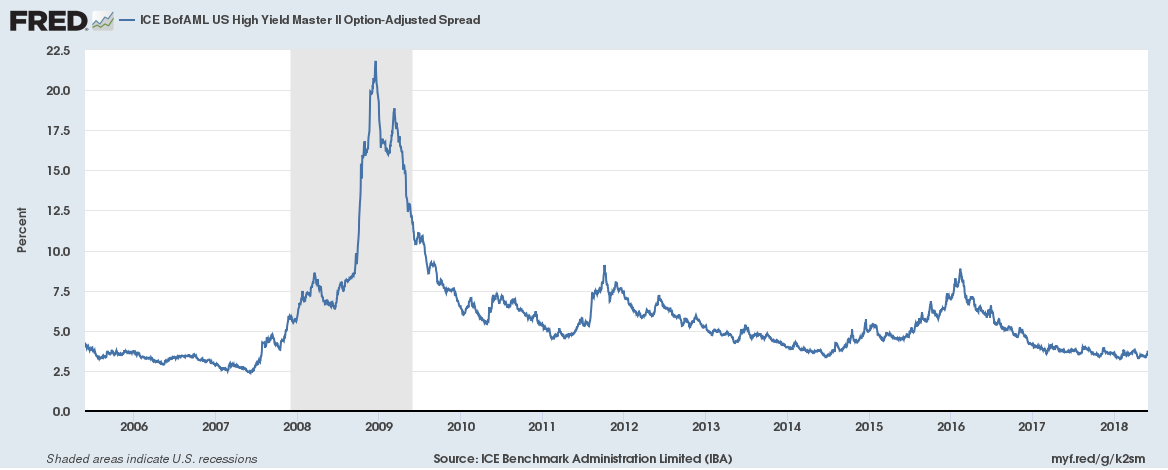 ICE Benchmark Administration Limited (IBA), ICE BofAML US High Yield Master II Option-Adjusted Spread [BAMLH0A0HYM2], retrieved from FRED, Federal Reserve Bank of St. Louis; https://fred.stlouisfed.org/series/BAMLH0A0HYM2, May 31, 2018.
I am not bringing your attention to these three graphs to predict we are getting ready to head into another recession. I bring your attention to these graphs to make the point that now is the time to be very selective with your investment decisions, primarily as it relates to loans and other esoteric investments. When you look at Standard and Poor’s definition of a BBB rating, you will find that typically your best loan customers may meet this rating. However, a large number of loans being booked on balance sheets might even meet the BB or lower rating, or junk bond, status. The market is telling us that there should be about 100 bps of spread between the very best borrower in the bank and the average borrower in the bank at the present time. If we go back to the beginning of 2016, we see that the market showed almost a 500 bps spread between these credits (BB spread in 2016 roughly 8% and BBB spread in 2016 roughly 3%).
What is unsettling is that I didn’t see many banks accounting for this difference in the pricing of loans in 2016. While management teams don’t set out to make any bad loans, history shows that even “good” loans go bad. Every loan and every borrower is different and should be priced based on the risk posed to the bank, not priced based on how the last loan was booked. In addition, when competitive pressure is at its highest, as we see now, pricing loans according to the risk they pose to the bank is the most challenging.
As mentioned in our May 11 PMR, we have tools to help bankers get an idea of how the market prices a loan structure. The Loan Builder® tool on our website, www.bancpath.com, provides insight into how we believe a particular loan structure should be priced. Steps 1 and 2 identify the duration of the loan to find the spot on the Libor curve for comparison. Steps 3, 4, and 5 would identify the OAS over that Libor spot curve for an amortizing loan structure. While the charts above provide the spread over a treasury for the different credit quality ratings, our Loan Builder pricing tool uses the spread over Libor.
Being diligent in fully understanding a credit prior to booking it and pricing it accordingly to the risk it truly presents should not make a difference when the economy is humming along. The difference comes when things get turbulent and credits start showing their true colors. The squeeze you feel at this point isn’t from tightening credit spreads, but rather from your capital, earnings, shareholders, and regulators.
Our team at AMG is here to help you and your team with various tools in understanding the pricing decisions that you make or should make. If you want help with our Loan Builder® tool on our website, or want to find out more about all the different tools we have to help with fully understanding your balance sheet, please let us know.