A View from the Tower – Third Quarter, 2023


Seven Large-Cap Growth Names Continue to Dominate
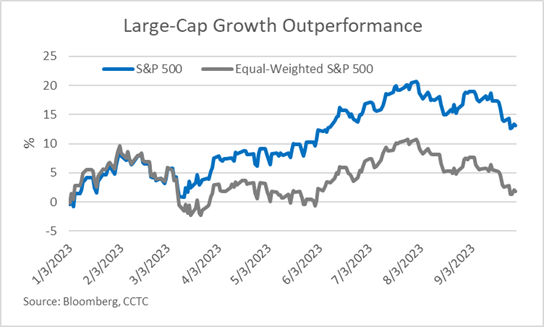 Stocks moved sideways for most of the quarter, fairly remarkable given the change in Treasury yields. Most of the pressure on equities occurred after the September Federal Open Market Committee (FOMC) meeting. Comments during Fed Chairman Powell’s press conference, as well as additional inflation fighting fodder from other FOMC members, sent bond yields significantly higher and stocks down.
A group of growth equities being referred to as the “Magnificent Seven” have driven the lion’s share of gains in both core and growth indexes for the year. The stocks: Nvidia, Tesla, Alphabet, Apple, Meta, Microsoft, and Amazon have accounted for approximately 85% of S&P 500 Index returns. Because the index is market-cap-weighted, these large cap growth names tend to drive index returns. The “Magnificent Seven” account for just under a 30% weighting in the S&P 500. Alternatively, we can look at an equal-weighted S&P 500 (+1.7% year-to-date) and see that the average stock hasn’t done much this year.
The Fed Continues to be Active in the Rates Market
The FOMC raised the Fed Funds rate by 0.25 percentage points in July, and left rates unchanged at its September meeting. The current Fed Funds target range is 5.25% - 5.50%, up one percent from the beginning of the year. Both moves were expected by markets, but changes to the Fed’s economic projections, and remarks from FOMC members following the September meeting were not. It is evident by the series of Fed 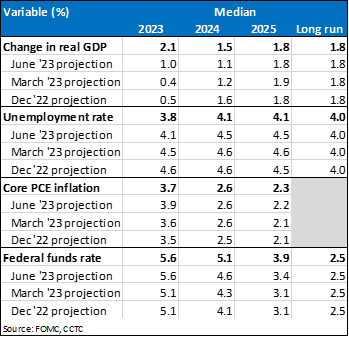 projections at the beginning of this year, that FOMC members believed they had achieved the correct policy stance to reduce Gross Domestic Product (GDP) growth and bring inflation down to their target level of 2%. At the time, it was three more 0.25 percentage point hikes in the Fed Funds rate and done. FOMC members had even penciled in substantial rate cuts in 2024, due to the expected slowing of growth. However, the resiliency of the U.S. economy has surprised many prognosticators, and Fed officials have become very hawkish, voicing a “higher for longer” theme on rates.
The significant change in the FOMC’s September predictions, highlighted in bold in the accompanying table, concerns higher GDP growth, the effect that growth has on the labor market and the interest rate needed to help rebalance supply and demand. Inflation projections have not changed materially.
Earlier in the year, the median FOMC projection for 2023 GDP growth was a tepid 0.4%. The latest estimate came in at 2.1%. Given the growth experienced in the first two quarters of this year, second-half GDP is expected to be up around 2% over the same period last year. That’s very close to consensus estimates, showing a considerable slowdown starting in the fourth quarter of this year, before accelerating into the back-half of next year. This “soft landing,” or non-recessionary slowdown is the hope in markets now, but there continues to be considerable disagreement about its fruition.
The Bond Market is Doing the Fed’s Work
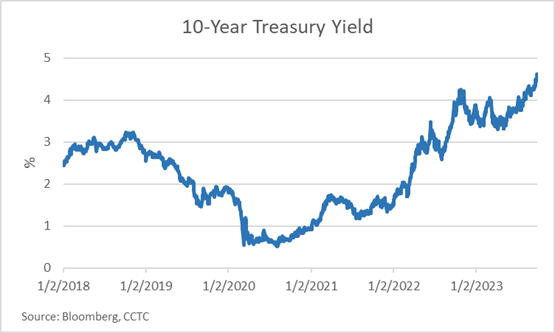 Central banks have many tools to slow economies. The bluntest, of course, is raising short-term rates. However, raising rates can have unintended consequences, playing a part in the bank failures we witnessed earlier in the year. Therefore, the most often used tool is something referred to as “forward guidance” to signal their policy intentions. This communication tool can have an immediate impact on financial markets. Statements, speeches, or press conferences by central bank officials can lead to changes in interest rates, exchange rates, and asset prices as market participants adjust their positions based on new information. The summary of economic projections, above, and the many hawkish statements by FOMC members since the September meeting, are part of these communications. We are certainly seeing an impact since the September meeting. The rate on the 10-year U.S. Treasury has spiked 0.40 percentage points and the S&P 500 is down. The Fed’s communications seem to be accomplishing what they wanted. Long-term borrowing costs are significantly higher, and some wealth destruction has occurred with falling equity markets. Both should act to slow the economy and promote the current disinflationary trend.
Have We Seen the Last Rate Hike?
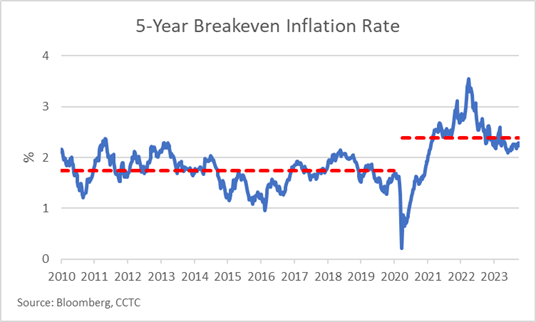 We tend to believe so, but see an outside chance of one more 0.25 percentage point hike before year-end. The FOMC suggests we get one more, but “forward guidance” doesn’t actually mean it’s the plan. We believe rate hikes and a potentially tiring consumer have us right where the Fed needs us to be (more on that below).
Futures markets are pricing in an 88% and 74% chance the Fed stays pat in November and December, respectively. Also, 5-year breakeven rates suggest the Fed has done enough to quash inflation and return us close to its 2% goal. The 5-year breakeven inflation rate is a market-based measure derived from the difference in yields between nominal and inflation-protected government securities. It represents the average annual inflation rate that investors expect over the next five years. This metric provides insights into market expectations regarding future inflation trends and is closely monitored by analysts and policymakers for economic assessments.
Inflation Tracking to Normalize Over the Next Year
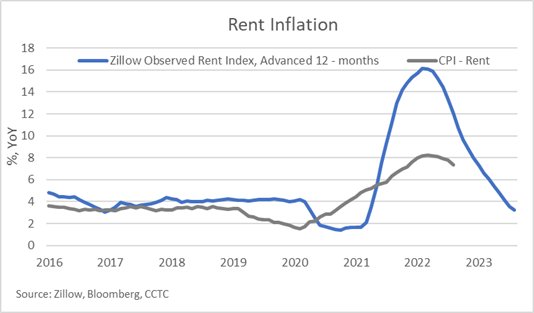 We do not believe reported inflation numbers completely gauge the current situation. Data can be skewed and lag the real-time economy. Reported rent inflation is a prime example. The methodology for computing rent prices for the Consumer Price Index, excluding food and energy (Core CPI), lags current conditions by about 12-months. This is significant as rents account for 40% of Core CPI. If we take a look at what is happening currently, using a rent index created by Zillow, we see a much lower contribution to inflation. Using real-time data would lower stated inflation by about 2.4 percentage points and get us close to 2%.
In Summary
This is our third quarterly publication of “A View From the Tower” for 2023. The theme of each publication has been similar, waiting…waiting…waiting. The Fed has raised rates roughly 5.50 percentage points since the beginning of 2022. Many were anticipating a considerable slowdown. We may be inching closer. Recessionary signals have been abundant over the past year, but, according to a Federal Reserve study referenced below, the consistent consumer has continued to draw down pandemic-era savings and spend. The manufacturing sector has been in a contraction for some time, but consumer driven service sectors have been providing growth. We are seeing some possible cracks on this front, however.
Bloomberg economists pulled data out of the latest Federal Reserve study of household finances and found that, after adjusting for inflation, the bottom 80% of households by income had exhausted pandemic-era excess savings. We are starting to see this by way of information coming from a few consumer facing companies. For six -months or so, Dollar General and Dollar Tree have warned investors that their customers are spending less. Spirit and Frontier airlines, both known for leisure travel, put the market on notice of a decline in bookings. Although nothing official, we have anecdotal evidence that Southwest Airlines is facing a similar situation. CarMax has announced that they are selling fewer cars. Falling demand from lower income brackets, a slowdown in leisure travel, fewer cars being sold – all leading indicators of a potential slowing economy.
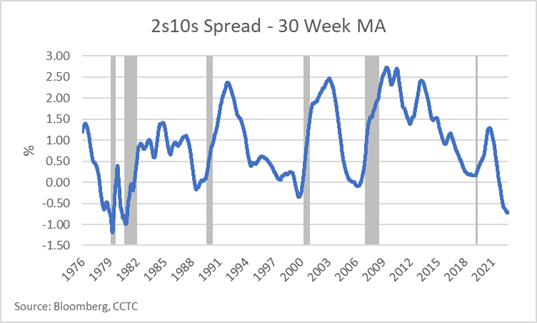 Finally, yet another indicator is in the beginning stages of making a recessionary call. We have written about the inverted yield-curve in the past. Prolonged periods where short-maturity bonds have a higher yield than long-maturity bonds have typically been an indicator that a recession was approaching. Importantly though, the recession doesn’t occur until the inversion starts to normalize – the negative rate spread between short and long maturities decline. We look at the 30-week moving average spread of 2-year and 10-year Treasuries. Unless something dramatic happens in the Treasury market, we seem to be heading in this direction.
Our portfolios are managed with both your risk tolerance and return objective in mind. We truly believe that time in the market is key, as attempting to time the market is a fool’s errand. In our view, compounding returns of high-quality portfolios is key towards achieving your financial goals.
All of us at Country Club Trust Company, along with the entire Country Club Bank organization, hope that you and your families are well. Please be assured that we continue to work diligently on your behalf, providing the level of service you have come to expect and deserve. As always, we are ready and willing to be of assistance in any way we can. Should you have any questions, we are always here for you.
Take care.
|
Mark Thompson, J.D.
Vice Chairman
|
Andrew Bradshaw, CFP®
Vice President
|
ADMINISTRATION
|
Andrea Russell
Assistant Vice President
|
|
Chuck Maggiorotto, CFA, CFP®
Chief Wealth Officer
|
Jeffrey A. Gentle, CFA
Vice President
|
Dean Lanier, J.D.
Executive Vice President
|
Mindy Boyd, CTFA
Trust Officer
|
|
M. Suzanne "Suzy" Hall, J.D.
President
|
Bart Wyrick
Vice President
|
Doug Hacker, CTFA
Senior Vice President
|
FINANCIAL PLANNING
|
|
INVESTMENTS
|
Ryan Self, CFP®
Portfolio Manager
|
Joe Hughes, CPA
Senior Vice President
|
Christopher Wolff, CFP®
Senior Vice President
Director of Financial Planning
|
|
Marcus A. Scott, CFA, CFP®
Chief Investment Officer
|
Nick Weber, CFA
Portfolio Manager
|
Jennifer Hunter, J.D. LL.M.
Senior Vice President
|
Jim Peavey, CFP®, ChFC®
Vice President
|
|
Paul Raccuglia, CFA
Senior Vice President/
Senior Portfolio Manager
|
Conner Gartner
Portfolio Management Associate
|
Mike Sukup, J.D.
Senior Vice President
|
Kevin Stone, CFP®
Vice President
|
|
Chance Pierce, CFA
Senior Vice President
|
Dakota McMahon
Portfolio Management Associate
|
Christine Sirridge, J.D.
Vice President
|
|
Disclosure for A View from the Tower: Country Club Bank Wealth Solutions is a general description for the collective wealth management products and services offered by or through Country Club Bank (CCB) including Country Club Trust Company, a division of Country Club Bank. Wealth Solutions products and services are not insured by FDIC/other federal agencies; are not deposits of/nor guaranteed by CCB or any of its subsidiaries/affiliates; and may lose value. Information provided in this document does not constitute legal/tax advice; is for illustrative and discussion purposes only; should not be considered a recommendation; and is subject to change. Some information provided above may be obtained from outside sources believed to be reliable, but no representation is made as to its accuracy or completeness. Please note that investments involve risk, and that past performance does not guarantee future results.